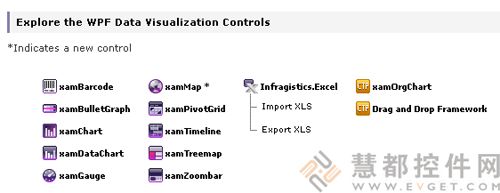
NetAdvantage® for WPF Data Visualization是一个综合的用户界面控件集,用于创建下一代具有给人鼓舞,激动人心以及授权的体验的Microsoft® Office® 2010外观感觉。使用Infragistics的全功能的UI控件生成的具有强大吸引力的数据可视化控件能够明确地和有效地传递信息,这些数据可视化控件如:高端的OLAP 转轴网格;高速的图表分析,仪表盘仪表,地理空间活地理交互用户界面,条形码,treemaps等(甚至有结构图表和在CTP中拖放的图表)。
NetAdvantage® for WPF Data Visualization is a comprehensive collection of User Interface controls for creating next generation experiences that inform, inspire and empower with the look and feel of Microsoft® Office® 2010. Communicate information clearly and effectively with Infragistics' fully-featured UI controls for producing insightful data visualizations such as: high-end OLAP pivot grids; high speed charting with analytics, dashboard gauges, geospatial or geographical interactive UIs, barcodes, treemaps and more (even organization charts and drag-and-drop in CTP).
主要功能一览:
从您的OLAP多维数据集中处理“如果…将会怎样?”的应用场景
使用WPF转轴网格来分片和切块您的多维OLAP数据(甚至可以是来自XMLA数据源,如SAP),给决策制定者强大的能力在很短的时间内找到他们的“What If?”应用场景的答案。
在地图上标出一切任何事物
随着关联有位置的业务数据的爆炸式增长,xamMap™是一个用于创建丰富的具有深度可缩放的多尺寸的图像能力的地图应用程序。获取一个实例视图并显示所有的事物,包括座位图表,平面图,仓库内容,并且也可以是地理地图。
动画WPF图表显示业务数据
使得千言万语的分析减小至一张清晰的一个可控告的商业智能图片。选择最好的图表控件,该控件能够实时更新处理百万数据点,具有丰富的坐标轴功能以及统计/技术指示器,或者它能够提供2D/3D图表可视化保证用户的透明感。
使用Gauges快速设计商业积分卡
使用具有真实感的WPF仪表盘控件监控您的业务关键绩效指标(KPI),该控件具有可以交互和高性能的特点。
一次监控多个等级的相信信息
WPF treemaps(在金融行业也称WPF heatmaps)让您的用户一目了然的检查您的分层数据的相对比重。
使用时间轴深入研究历史数据
通过简单的可视化这些数据为日期为导向和在一个WPF时间轴上的按顺序排列的事件来深入到您的业务交易,工作流,以及处理流程的生命线,这样使得即使在最大的数据集上也能够快速的工作。
简明地测量好,很好和最好
一个简单明了的WPF图形符号一目了然的让用户确切的知道他们对目标的进展情况。
首次精确地识别资产
渲染许多常用的条码符号集,如QR条码,UPC条码等等。在标准的条码格式中能够准确而有效地识别从医疗记录到库存单位(SKUs)的一切任何事物。
德国语言本地化
出现在您控件的WPF运行时对话框,按钮以及其他UI元素的所有的静态文本都已使用英语和德语本地化,您的软件具有这样的特点使得能够扩充它的市场。
社区技术预览
创建的组织图表能够处理数以千计的实体(远超过大多数组织的需求,具有惊人的速度!),并且通过我们的技术预览添加了拖放功能到您的WPF数据可视化中。
Key Features at a Glance
Handle "What If?" Scenarios from your OLAP Cube
Using the WPF pivot grid to slice and dice your multidimensional OLAP data (even from XMLA data sources like SAP) empowers decision makers to find answers to their "What If?" scenarios in no time.
Map out anything and everything
With the explosive growth in business data tied to location, the xamMap™ is an indispensible tool for creating rich mapping apps capable of deep zoom with multi-scale images. Get an instant view and show anything including seating charts, floor plans, warehouse contents, and yes—geographic maps, too.
Animate WPF Charts Showing Business Data
Reduce a thousand words of analysis into one clear picture of actionable business intelligence. Choose the best chart control that handles millions of data points with real-time updates, with rich axes capabilities and statistical/technical indicators, or that provides 2D/3D charting visualizations to engage the user's sense of perspective.
Design Business Scorecards in No Time with Gauges
Monitor your business' key performance indicators (KPI) with the photorealistic WPF gauge controls that feature interactivity as well as high performance.
Monitor Multiple Levels of Detail at Once
WPF treemaps (also known as WPF heatmaps in the financial industry) allow your users to examine the relative weighting of your hierarchical data at a glance.
Delve into Historical Data with Timelines
Dive deeply into the lifeblood of your business transactions, workflows, and processes by easily visualizing them as date-oriented and sequentially ordered events in a WPF timeline that makes quick work of even the largest data sets.
Concisely Measure Good, Better and Best
One glance at the concise and clear WPF bullet graph lets your users ascertain their progress towards a goal.
Identify Assets Accurately the First Time
Render many frequently-used barcode symbologies like QR codes, UPC codes and more, in standard barcode formats that accurately and efficiently identify anything and everything from medical records to stock keeping units (SKUs).
German Language Localization
Expand the market for your software with all static text appearing in our controls' WPF run-time dialogs, buttons and other UI elements localized for both English and German.
Community Technology Previews
Create organization charts that can handle tens of thousands of entities (far more than most organizations even need, with blazing speed!), and add drag-and-drop to your WPF data visualizations with early access to our technology previews.


 首页
首页 


 实时了解产品最新动态与应用


 相关产品
相关产品 授权相关问题
 微信
微信 在线咨询
在线咨询


 渝公网安备
50010702500608号
渝公网安备
50010702500608号

 客服热线
客服热线